Village

Tutbury

Above the Dove, a castle and former priory church mark a medieval estate centre. Below them, mills and glassworks brought new kinds of work to a settlement spanning an important county boundary.

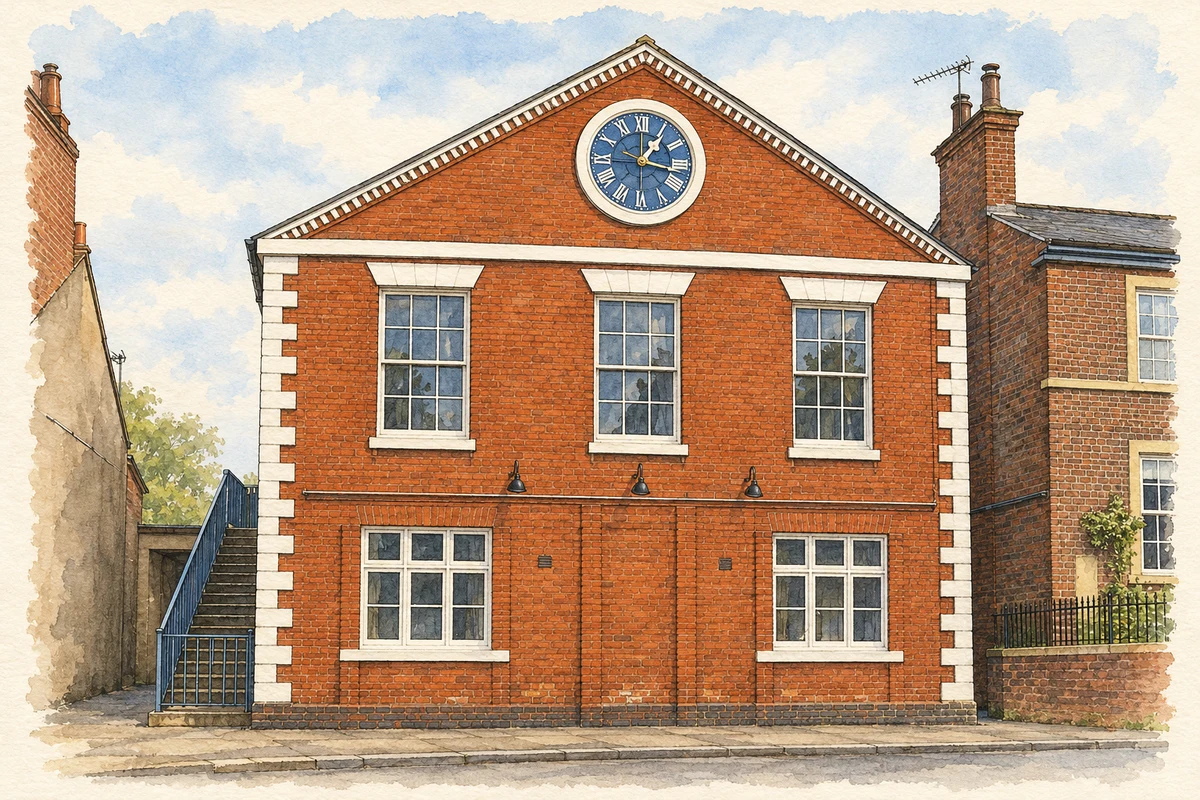
Watercolour and fine ink illustration of Tutbury Institute
Illustration · Tutbury Institute
History & heritage

Place & story

Lordship above the river

Tutbury Castle occupies a natural promontory overlooking the Dove floodplain. Its mound and baileys exploited steep ground, while banks and ditches strengthened the more accessible sides. [2]

The medieval settlement developed below castle and priory. Staffordshire’s historical account records forty-two men earning their living in the borough in 1086. The Ferrers lordship later passed to the Lancasters, tying the town to an estate much larger than the village itself. [3]

A church survives the priory

Tutbury Priory was dissolved in 1538. The western part of its church survived to become St Mary’s parish church, while the other monastic buildings disappeared. Its twelfth-century west front and Norman south-door lintel, carved with a boar hunt, preserve evidence of the earlier institution within a continuing place of parish worship. [3]

The town’s economic institutions also had ceremonial forms. Minstrels gathered at the August fair and were licensed by the earls’ officers; their court became a kind of trade organisation. John of Gaunt strengthened its authority. The custom outlasted its medieval origins, continuing in diminished form into the nineteenth century. [3]

Captivity, siege and the making of ruins

Crown ownership followed in 1399, and the castle administered a major Duchy of Lancaster estate. Its buildings accumulated over centuries: John of Gaunt’s Gate, curtain walls, towers and later royal lodgings belonged to successive phases of occupation. [2]

Royalist defenders strengthened the castle during the Civil War. After its capture in 1646, Parliamentarians dismantled the fortifications. An ornamental tower later crowned the mound. [2]

Mills, materials and changing employment

A partnership formed in 1782 built a five-storey mill beside Bridge Street between 1783 and 1785. Initially working wool as well as cotton, it concentrated on cotton from the mid-1790s. Its closure in 1888 did not immediately end industrial use: Henry Newton reopened it for plaster manufacture, connecting riverside processing with gypsum mining in the wider district. [4]

Glass developed along another route. A works at Burton and Ludgate Streets began in 1810 by cutting glass made in Birmingham, before manufacturing it by 1839. Tutbury’s industrial economy therefore included both the finishing of imported material and production in the town. Skilled work helped turn a former estate centre into a manufacturing settlement. [4]

The surviving Silk Mill on Silk Mill Lane carries a different industrial history. Historic England dates it to the early eighteenth century and associates its construction with William Lombe. Brick walls, three floors and small arched window openings survive, but none of the machinery remains. The building, later associated with Georgian Crystal, preserves a workplace shell rather than a complete production process. [5]

Back to contents
Lives connected to this place

Notable people

Mary, Queen of Scots: a prisoner’s connection

Mary, Queen of Scots was held at Tutbury during episodes of captivity in 1569, 1570 and 1585. Her connection was enforced residence in an English fortress, rather than local birth or rule. The castle’s place in her history reveals another use of a ducal stronghold: accommodating and guarding a politically important prisoner. [2]

Alexander Sivewright: glassblower and organiser

Alexander Sivewright arrived in Tutbury in the late 1830s as a glassblower at the expanding Ludgate Street works. He became national secretary of the glassmakers’ union. In 1863 he resigned his job and union office to open his own glass factory across the Dove in Scropton Lane, Hatton. [6]

His factory attracted skilled workers away from Ludgate Street but closed in 1868 after financial failure. Sivewright died in 1872. His career connects worker organisation with the risks of ownership and shows why the glass district has to be understood across the river, while keeping Hatton and Tutbury distinct. [6]

Back to contents
A chronology

Timeline

Tutbury through time

  1. 1086 — Domesday records a working borough beneath the castle. [3]

  2. 1399 — The castle becomes Crown property. [2]

  3. 1538 — The priory is dissolved; part of its church survives for parish use. [3]

  4. 1646 — The Royalist castle falls and its defences are dismantled. [2]

  5. 1783–85 — A partnership constructs the large riverside textile mill. [4]

  6. 1810 — Glass cutting begins at the Burton Street and Ludgate Street works. [4]

  7. 1863 — Sivewright establishes a glass factory at neighbouring Hatton. [6]

  8. 1888 — The cotton mill closes and subsequently gains a new use making plaster. [4]

Back to contents

Population over time

Built-up area · Settlement · Census 2021

Tutbury

3,675people · 2021

Census 2021 population of the named settlement, using ONS built-up area boundaries.

Published census counts.

Sources: ONS: Towns and cities, characteristics of built-up areas, Census 2021 (Table 1c)

View population figures
Tutbury — census population
Census yearPopulation
20213,675
Sources and how to read this chart

Usual residents on 21 March 2021; published ONS count rounded to the nearest 5.. Boundary geography: December 2022 (E63002171).

Census 2021 population of the named settlement, using ONS built-up area boundaries.

ONS Table 1c rounds counts to the nearest 5 and suppresses counts below 10. Matched by exact settlement name or individually reviewed district-qualified name, with its coordinate strictly inside that same official BUA boundary. The 2022 BUA geography changed methodology and cannot be directly compared with 2011 BUAs. Contains OS data © Crown copyright and database right 2026. Contains National Statistics data © Crown copyright and database right 2026.

Source: ONS: Towns and cities, characteristics of built-up areas, Census 2021 (Table 1c). Open Government Licence v3.0. Retrieved 2026-10-26. Source: ONS and Ordnance Survey: Built Up Areas December 2022 GB BGG. Open Government Licence v3.0. Retrieved 2026-10-26.

Neighbourhood census context

These figures describe statistical neighbourhoods, which may cover part of a place or include neighbouring places.

Neighbourhood census area · 1971–2021

East Staffordshire 004

Population of the area containing the recorded point for Tutbury, not the whole place. This area may cover part of the place or include neighbours.

05k10k15k20k1971: 9,690 people19711981: 8,849 people19811991: 8,346 people19912001: 8,363 people20012011: 9,158 people20112021: 10,440 people2021

Includes harmonised historical census estimates.

Sources: ONS · Paul Norman

View population figures
East Staffordshire 004 — census population and harmonised historical estimates
Census yearPopulation
19719,690
19818,849
19918,346
20018,363
20119,158
202110,440
Sources and how to read this chart

Usual residents of the containing MSOA; this is local area context, not the population of the named settlement.. Boundary geography: 1 April 2022 (E02006134).

2011 and 2021 census counts harmonised by ONS to the same 1 April 2022 geography. Location matched to ONS 2021 MSOA polygons (full resolution, coastline clipped, V7). ONS exact-fit lookup marks this MSOA unchanged from 2011 (U); historical estimates use that same footprint.

1971–2011: Paul Norman harmonised historical estimates on 2011 MSOAs, rounded to whole residents (1971–1991 are modelled). 2021: ONS census count. The historical 2011 total can differ slightly from the ONS change-over-time 2011 total because of methodology and statistical disclosure controls. These are area estimates, not settlement totals.

Source: ONS Census change over time: usual resident population, 2011 and 2021. Open Government Licence v3.0. Retrieved 2026-10-26. Source: ONS MSOA December 2021 boundaries EW BFC V7. Open Government Licence v3.0. Retrieved 2026-10-26. Source: Paul Norman — Area characteristics: Great Britain 1971 to 2011. Creative Commons Attribution 4.0. Retrieved 2026-10-26. Source: ONS MSOA 2011 to MSOA 2021 exact-fit lookup for England and Wales. Open Government Licence v3.0. Retrieved 2026-10-26.

Recorded locationTutbury52.85685° N · 1.68631° WInteractive map loads when this area enters view.
Approximate recorded location · Geographic source

Geographic context

Place type
Village
Country / region
England · West Midlands
County group
Staffordshire
Current administration
East Staffordshire
Current administration
Staffordshire
Recorded coordinates
52.85685, -1.68631
OS Open Names ID
osgb4000000074552001

County groups are browsing aids. Current administrative and historic areas are recorded separately.

Recorded names

  • Tutbury · en · official

Nearby heritage

Distances are from the recorded place point. Proximity does not establish that a site lies within the place boundary or belongs to its history.

Sources & further reading

  1. OS Open Names October 2026 · Source licence.
  2. Tutbury Castle, scheduled monument 1006112 · Historic England
  3. Tutbury historical introduction · Staffordshire County Council / Staffordshire Past Track
  4. Tutbury Extensive Urban Survey · Staffordshire County Council
  5. The Silk Mill (Georgian Crystal), 1376509 · Historic England
  6. A Tutbury Fairy Tale: The Early History of Glassmaking in Scropton Lane · Tutbury Museum
  7. Illustration of Tutbury Institute, adapted from Tutbury Institute.jpg by Dave Bevis. CC BY-SA 2.0. AI-assisted watercolour and fine ink adaptation; cream paper margins, simplified fine detail and removal of incidental street clutter.

Geographic source retrieved 2026-10-26. History last researched 2026-10-27. How this page was prepared.